Hardware debugging
The code can be compiled with debugging information, you can then upload a debug version to a board via a JLink/St-Link debug adapter and step through the code in your IDE.
For a VS Code set-up, see Debugging with VS Code and J-Link.
A guide for visual studio can be found here: http://visualgdb.com/tutorials/arm/st-link/
This video is also helpful in understanding the proces: https://www.youtube.com/watch?v=kjvqySyNw20
Hardware
Various debugging hardware solutions exist, the Segger J-Link clones are cheap and are known to work on Windows with both the Naze and Olimexino platforms.
J-Link devices
Segger make excellent debuggers and debug software.
The Segger J-Link GDB server can be obtained from here.
http://www.segger.com/jlink-software.html
Segger J-Link EDU EDU version, for hobbyists and educational use.
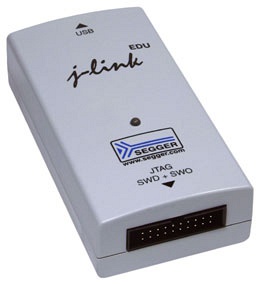
https://www.segger.com/j-link-edu.html
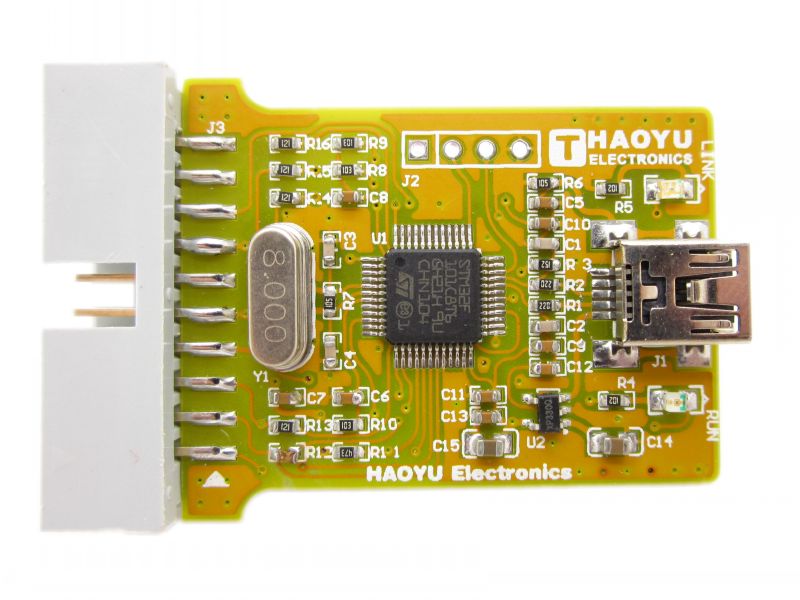
USB-MiniJTAG J-Link JTAG/SWD Debugger/Emulator
http://www.hotmcu.com/usbminijtag-jlink-jtagswd-debuggeremula%E2%80%8Btor-p-29.html?cPath=3_25&zenid=fdefvpnod186umrhsek225dc10
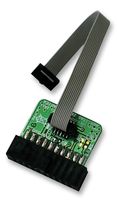
ARM-JTAG-20-10 adapter
https://www.olimex.com/Products/ARM/JTAG/ARM-JTAG-20-10/ http://uk.farnell.com/jsp/search/productdetail.jsp?sku=2144328
CJMCU-STM32 Singlechip Development Board Jlink Downloader Jlink ARM Programmer
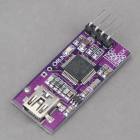
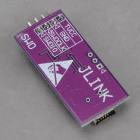
http://www.goodluckbuy.com/cjmcu-stm32-singlechip-development-board-jlink-downloader-jlink-arm-programmer.html
STLink V2 devices
STLink V2 devices can be used too, via OpenOCD.
CEPark STLink V2
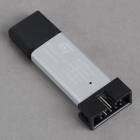
http://www.goodluckbuy.com/cepark-stlink-st-link-v2-emulator-programmer-stm8-stm32-downloader.html
Compilation options
- Use
make DEBUG=INFO ...to build with debug information for gdb to load, without affecting the code optimization. - Use
make DEBUG=GDB ...to build with reduced optimization to preserve debugging (-Og).
You may find that if you compile all the files with DEBUG=GDB on that the program is too big to fit on the target device. If this happens you have some options:
- Compile all files with normal optimization (
make clean,make DEBUG=INFO ...), then re-save ortouchthe files you want to be able to step though and then runmake DEBUG=GDB .... This will then re-compile the files you're interested in debugging with debugging symbols and you will get a smaller binary file which should then fit on the device. - You could use a development board such as an PORT103R, development boards often have more flash rom.
OSX
Install OpenOCD via Brew
ruby -e "$(curl -fsSL https://raw.githubusercontent.com/Homebrew/install/master/install)"
brew install openocd
GDB debug server
J-Link
Windows
Run the Launch the J-Link GDB Server program and configure using UI.
OpenOCD
Windows
STM32F103 targets
"C:\Program Files (x86)\UTILS\openocd-0.8.0\bin-x64\openocd-x64-0.8.0.exe" -f interface/stlink-v2.cfg -f target/stm32f1x_stlink.cfg
STM32F30x targets
"C:\Program Files (x86)\UTILS\openocd-0.8.0\bin-x64\openocd-x64-0.8.0.exe" -f scripts\board\stm32f3discovery.cfg
OSX/Linux
STM32F30x targets
openocd -f /usr/share/openocd/scripts/board/stm32vldiscovery.cfg