Hardware Debugging with VSCode and JLink
This doc will guide you to set up Rotorflight firmware debugging in VSCode.
Assumptions and Prerequisites
- JLink: This guide assumes JLink. ST-Link/OpenOCD should be possible. but unverified.
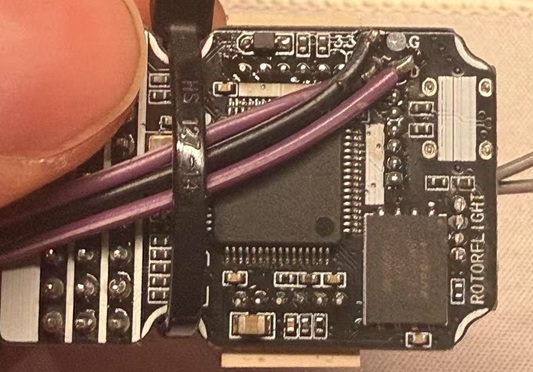
- Flydragon V2: Other controllers should be very similar.
- SWD wiring: SWDIO, SWCLK, 3.3V, GND are required. SWO pin is optional for advanced topic.\
- Linux build environment.
- VSCode workspace connected to the build environment.
- JLink, VSCode and build environment can be on 3 different hosts.
- Optionally, use rotorflight-configurator to download your built firmware once, to load board config.
Setup
JLink host
(Skip if JLink and build environment are on the same host):
1. Install JLink software.
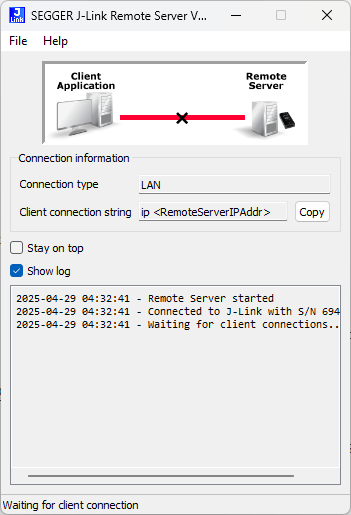
2. Run "JLink Remote Server" and start the server.\
Build environment
- Install JLink software too.
- Install a recent version of
arm-none-eabi-gdb. In my case, it is under/usr/bin/arm-none-eabi-gdb. - Run
make cleanonce, in case you have some cached.oand.elfwithout debug info.
VSCode
- Open your rotorflight-firmware workspace.
- Install extension Cortex-Debug.
- Add these settings to
.vscode/settings.json:"cortex-debug.armToolchainPath": "${workspaceRoot}/tools/gcc-arm-none-eabi-9-2020-q2-update/bin/", "cortex-debug.gdbPath": "/usr/bin/arm-none-eabi-gdb", - Create
.vscode/tasks.json(or merge) with the following content:{ "version": "2.0.0", "tasks": [ { "type": "shell", "label": "build STM32F7X2", "command": "make", "args": ["STM32F7X2", "DEBUG=INFO"], "problemMatcher": [], "options": { "cwd": "${workspaceFolder}" }, "presentation": { "close": true }, } ] } - Create
.vscode/launch.json(or merge) with the following content:{ "version": "0.2.0", "configurations": [ { "name": "Launch STM32F7X2 JLink", "cwd": "${workspaceRoot}", "executable": "${workspaceRoot}/obj/main/rotorflight_STM32F7X2.elf", "request": "launch", "type": "cortex-debug", "servertype": "jlink", "serverpath": "JLinkGDBServerCLExe", "ipAddress": "xxx.yyy.aaa.bbb", // Replace with your JLink host. Remove if run locally. "device": "STM32F722RE", "runToEntryPoint": "main", "serverArgs": [ "-speed", "6000" // Optional: in case your jlink doesn't auto detect optimal speed for you ], "swoConfig": { "enabled": true, "source": "probe", "swoFrequency": 2000000, "cpuFrequency": 216000000, "decoders": [ { "port": 0, "type": "console", "label": "SWO output", "encoding": "ascii" } ] }, "preLaunchTask": "build STM32F7X2" } ] } - Now go to
Run and Debugpanel, select the configuration you just created, and click the green play button.\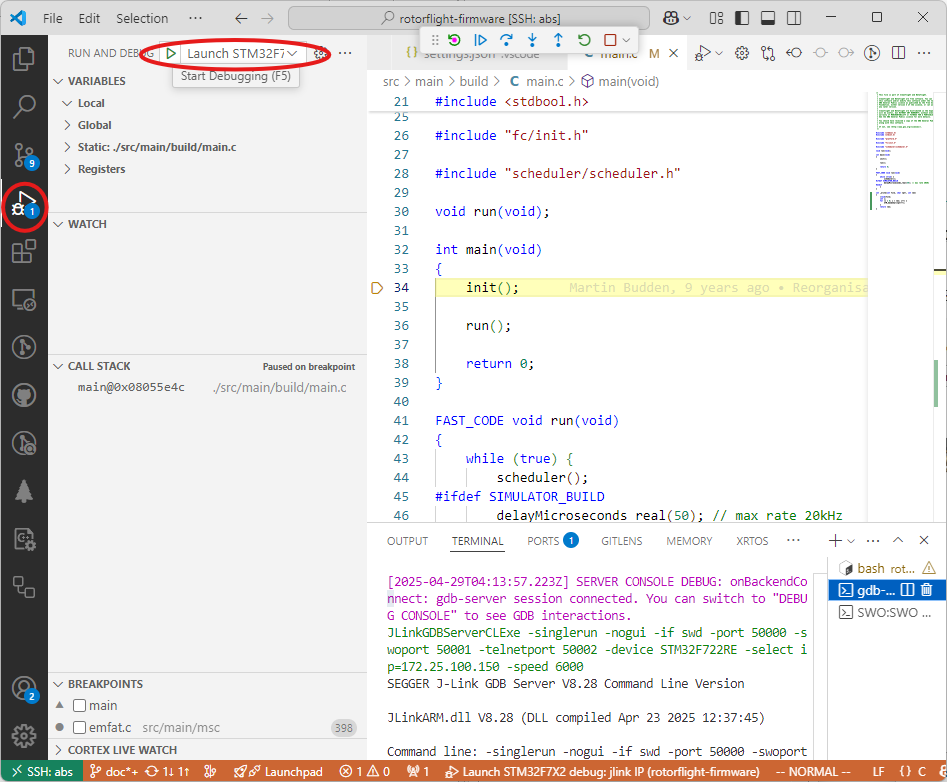 \
VSCode will build, download and start a debug session.
\
VSCode will build, download and start a debug session. - JLink by default only erases affected sections. Therefore, the configuration will preserve. In case you did not pre-load board config in the prerequisite steps, you can still manually download it from rotorflight-target (Flydragon V2) and load it in cli.
Advanced debugging topic
Attach to a running target
Use this Launch configuration:
    {
      "name": "Attach STM32F7X2 JLink",
      "cwd": "${workspaceRoot}",
      "executable": "${workspaceRoot}/obj/main/rotorflight_STM32F7X2.elf",
      "request": "attach",
      "type": "cortex-debug",
      "servertype": "jlink",
      "serverpath": "JLinkGDBServerCLExe",
      "ipAddress": "xxx.yyy.aaa.bbb", // Replace with your JLink host. Remove if run locally.
      "device": "STM32F722RE",
      "serverArgs": [
        "-speed", "6000" // Optional: in case your jlink doesn't auto detect optimal speed for you
      ],
      "swoConfig": {
        "enabled": true,
        "source": "probe",
        "swoFrequency": 2000000,
        "cpuFrequency": 216000000,
        "decoders": [
          {
            "port": 0,
            "type": "console",
            "label": "SWO output",
            "encoding": "ascii"
          }
        ]
      }
    }
launch->attach, remove runToEntryPoint and preLaunchTask)
SWO
SWO is an optional debug pin can be used for various purposes (https://kb.segger.com/SWO).
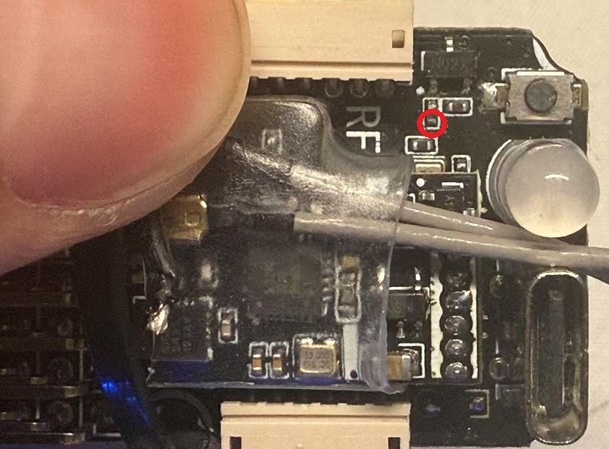
On Flydragon, the SWO pin (PB3) is not exposed as a pad but connects to the buzzer (through a driver circuit). You will need to carefully solder a wire to this tiny resistor:\
 \
\
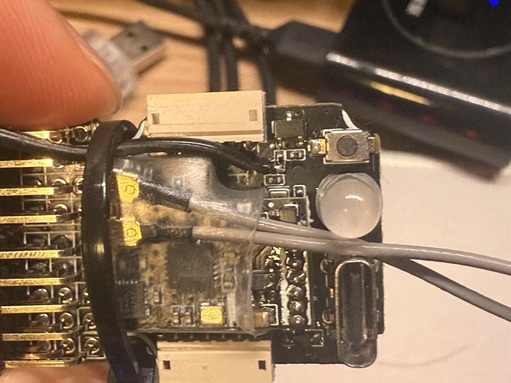
And also unmap the pin from buzzer:
Resource BEEPER 1 NONE
SWO terminal
You can utilize high speed SWO terminal to print debug strings. First, add this piece of code to any (linked) .c file:
int _write(int file, char *ptr, int len)
{
    (void) file;
    int i;
    for (i = 0; i < len; i++) {
        ITM_SendChar(*ptr++);
    }
    return len;
}
Comment out this line from src/main/common/platform.h which prevents us to compile printf.
#pragma GCC poison sprintf snprintf
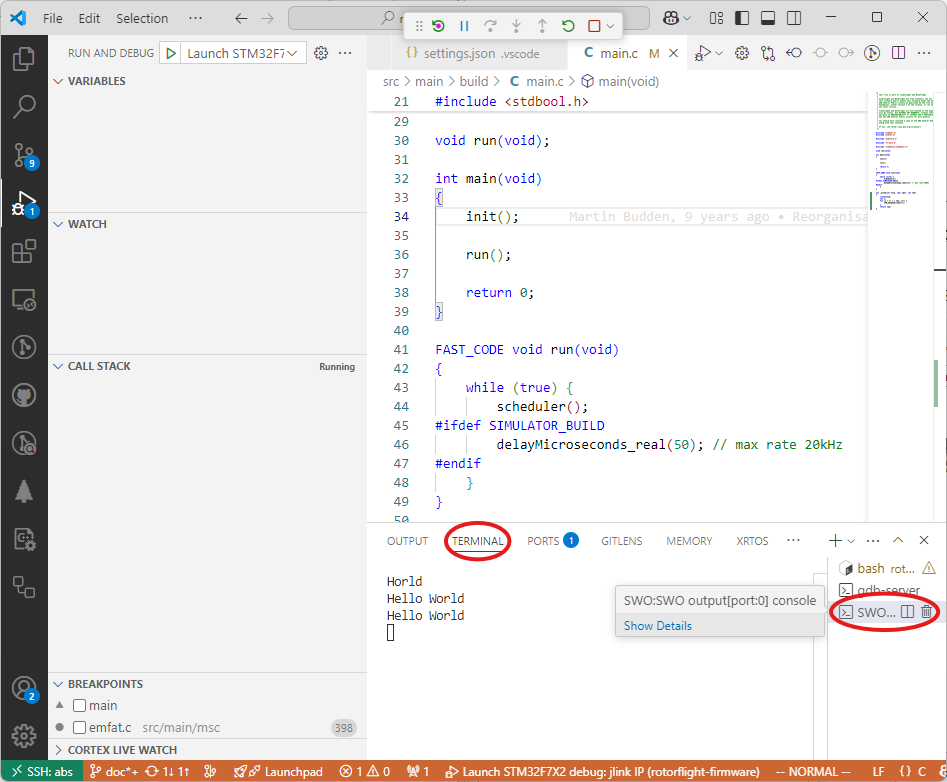
Now you can printf anywhere in the code and the output will be shown in the "TERMINAL" -> "SWO:SWO console":\
SWO graphing
You can send values to different ITM channels and plot a graph. This is useful to track multiple variables or state machines. Refer to https://github.com/Marus/cortex-debug/wiki/SWO-Output#output-graphing-graphing.
SWO trace
SWO trace is currently not supported by Cortex-Debug extension. I suggest to use SEGGER Embedded Studio for this task -- "An externally built executable for a Cortex-M processor" project.